Products
Solutions
Resources
9977 N 90th Street, Suite 250 Scottsdale, AZ 85258 | 1-800-637-7496
© 2024 InEight, Inc. All Rights Reserved | Privacy Statement | Terms of Service | Cookie Policy | Do not sell/share my information

To launch the Plan application, you must first open the InEight software in your web browser, using the link provided by your manager or facilitator.
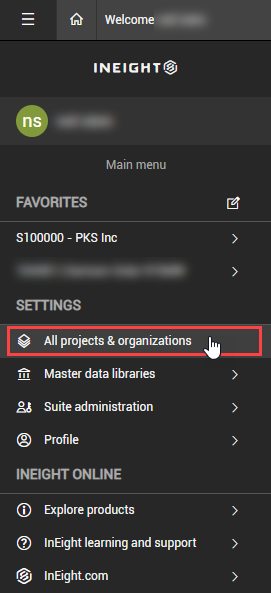
Open the All projects & organizations page from the Main menu.
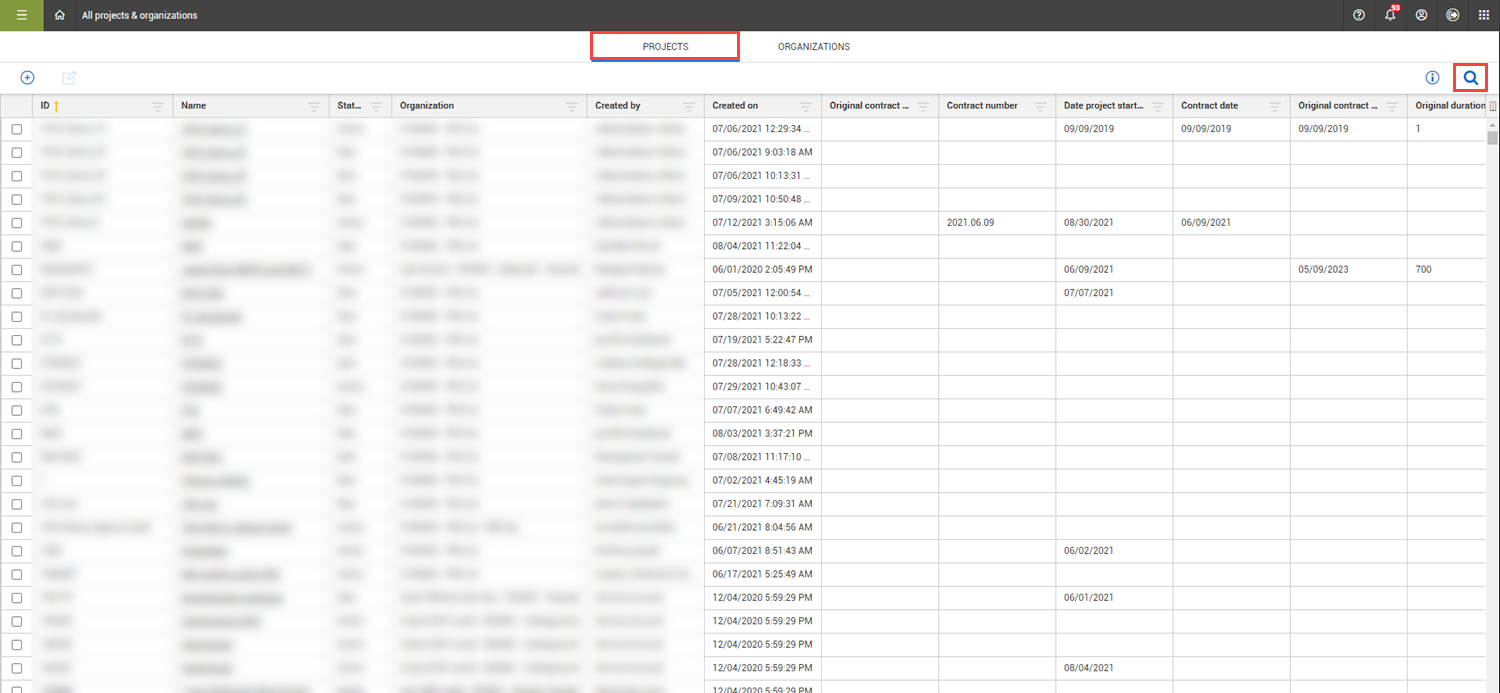
On the Projects tab you can select any project you are associated with. If your project is not shown on the initial screen, you can search by selecting the Search icon in the top right corner.
When you select a project, it takes you to the Project home page.
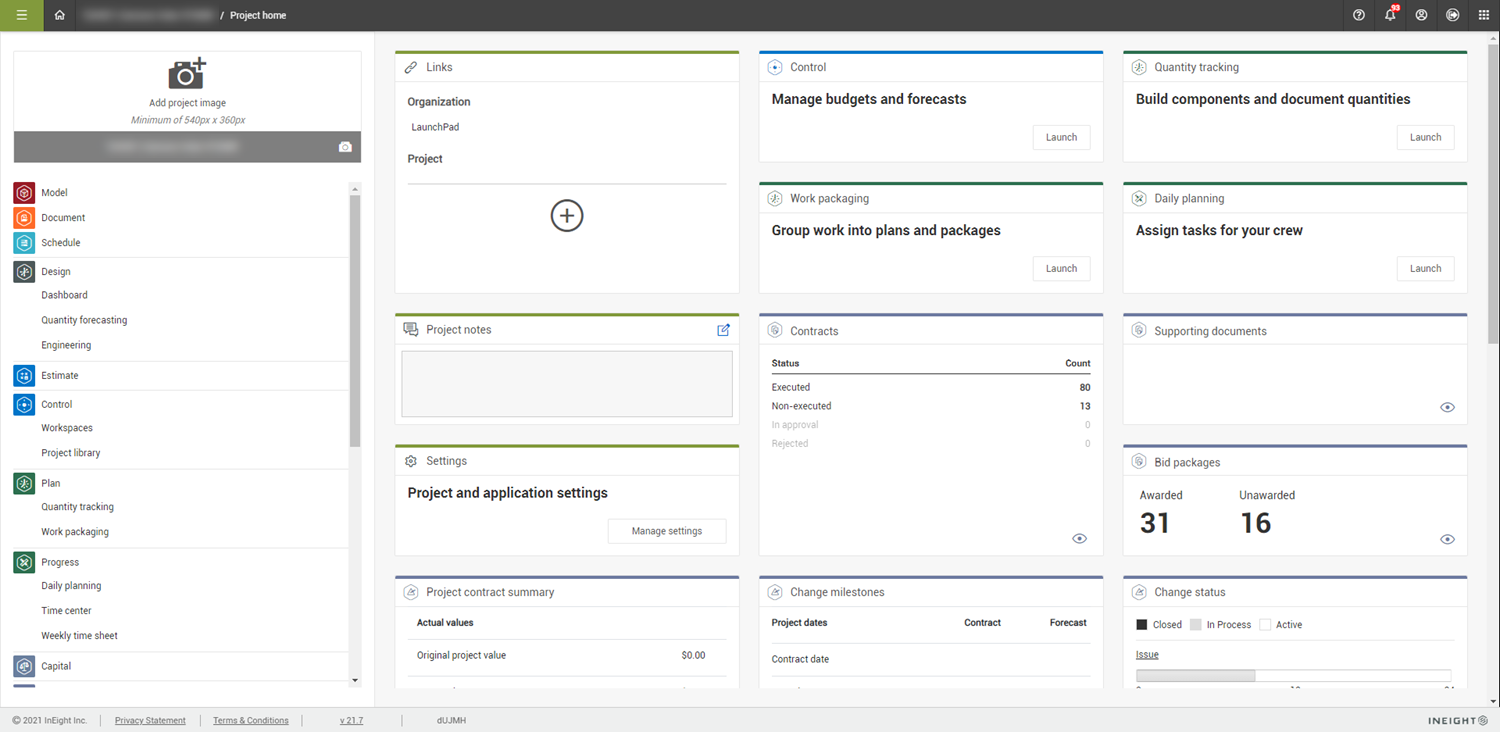
From here, you can launch Plan Quantity tracking in several ways:
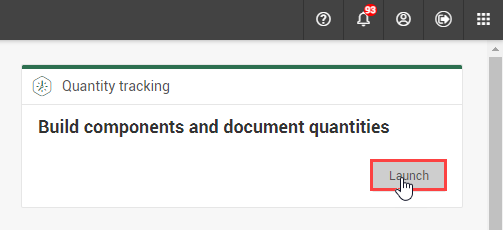
Clicking the Quantity tracking Launch application tile
Selecting Plan > Quantity tracking from the left menu
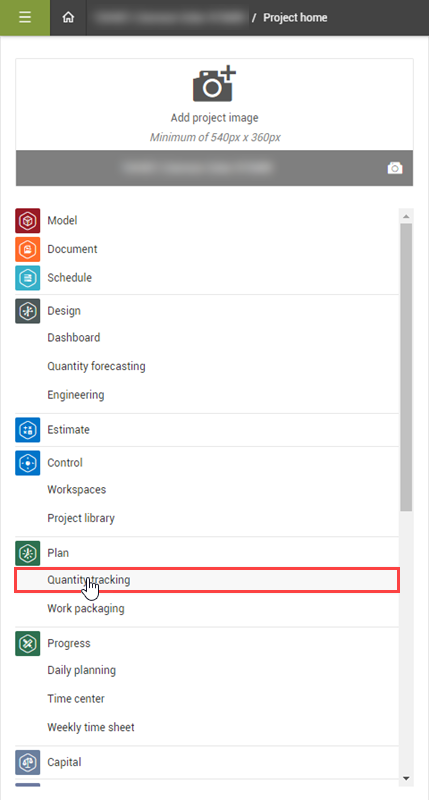
Selecting Plan > Quantity tracking from the second-level drop-down menu for a specific organization or project at the top of the page
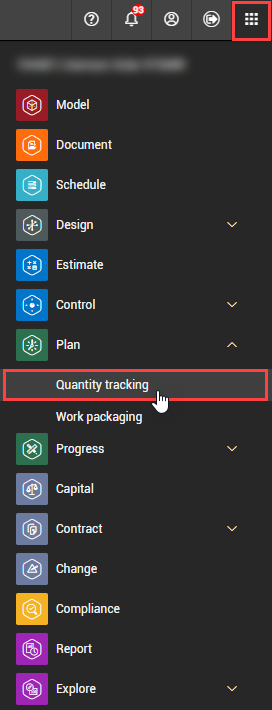
Selecting Plan > Quantity tracking from the app launcher icon in the upper-right corner of the page
The following steps walk you through launching Quantity tracking using the second-level drop-down menu at the project level.
From the Projects tab of the All projects & organizations page, click on the project name hyperlink to select a project.
This opens the Project home page.
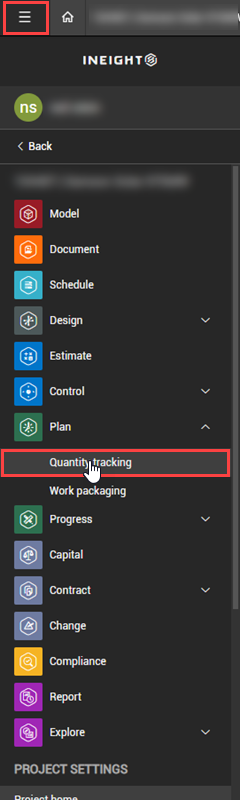
From the Project home page, click the main menu icon, and then click the project name to open the second-level menu.
From the second-level drop-down menu, open the Plan drop-down menu, and then select Quantity tracking.
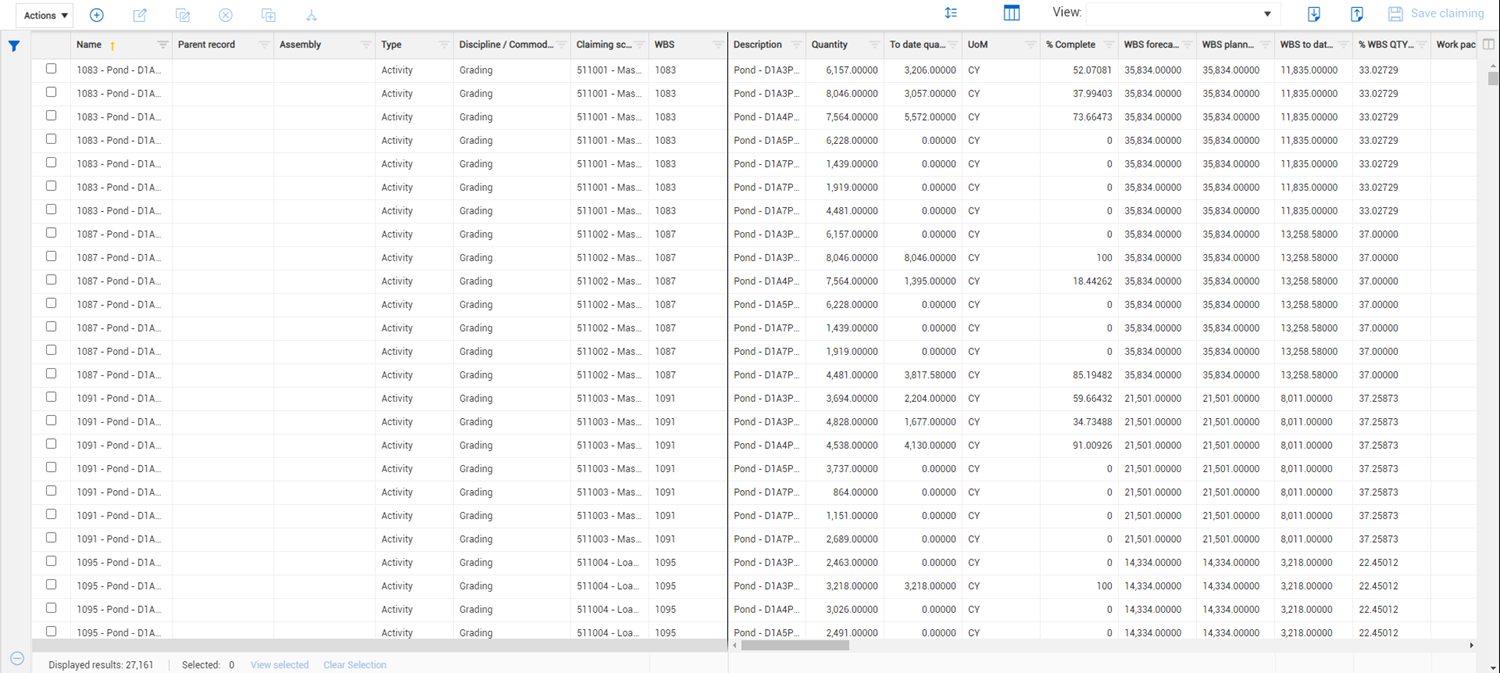
This brings you to the Quantity tracking page.
|
Title |
Description |
|
|---|---|---|
|
1 |
Actions |
Contains available actions for the current tab. |
|
2 |
Left toolbar |
Options to add, edit, bulk edit, delete, copy, and split components. |
|
3 |
Grid view options |
|
|
4 |
Views |
Lets you create, save, change and share views. |
|
5 |
Import, Export, and Save claiming |
|
| 6 | Query options |
|
| 7 | Components | Shows components in a table according to the applied query and filters. |
| 8 | Results and selection counts | Shows the counts of results and selected components. Choose whether to view selected components or clear your selection |
![]()
The Components page has two separate views: Standard Grid view and Data Block view. By default, the Components page opens in the Data Block view.
The Standard Grid view offers a traditional spreadsheet look with rows and columns.
The Data Block view groups columns for a cleaner viewing experience focused on claiming. Data Blocks are covered in more detail in the Data Blocks topic.

Easily switch between the two views by clicking the View as button on the toolbar.
 xx
xx 
Custom URLs can be generated from a source program, which can be shared as a direct link to Quantity tracking that filters to a specific WBS code.
The exact URL depends on your organization setup but the URL ends with AppPlan/QuantityPlan/QuantityPlanLaunch?projectId=[ProjectID]&WBSPhaseCode=[WBS].
When the URL is accessed, the grid shows with the applied filters and the URL returns to its default value for the Plan Quantity tracking page. The component edit slide-out shows the matching records.
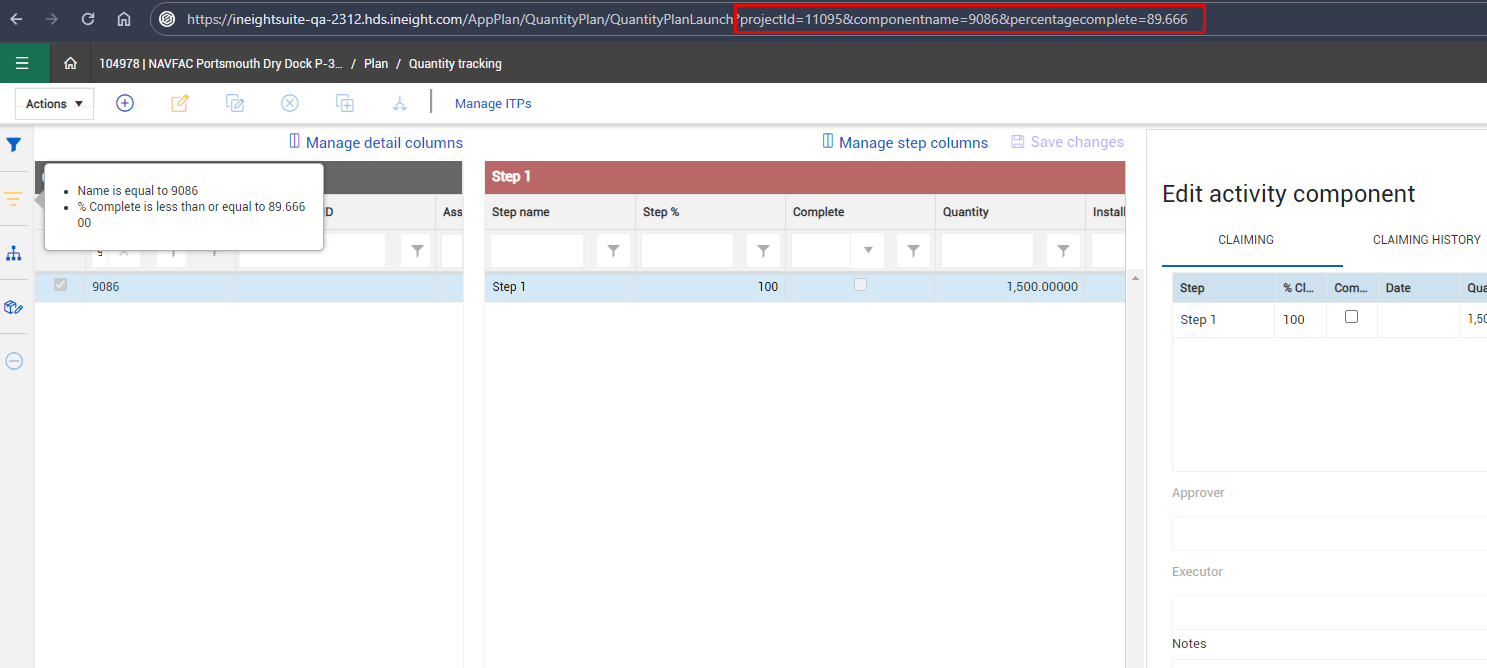
The system will filter the following columns which can be combined when creating a custom URL string:
projectid (required)
componentname
scheduleofvaluesitemid
wbsphasecode
area
segment
system
subsystem
turnover
percentagecomplete
Additional Information
9977 N 90th Street, Suite 250 Scottsdale, AZ 85258 | 1-800-637-7496
© 2024 InEight, Inc. All Rights Reserved | Privacy Statement | Terms of Service | Cookie Policy | Do not sell/share my information